Multi-ROI Properties and Settings
Quantification in Dragonfly is based on the concept of a multi-ROI, in which each group of connected voxels is labeled as a distinct object. Whether or not two voxels are connected is defined by their connectivity, that is, which voxels are neighbors and which are not.
Each multi-ROI that is created or imported appears on a separate line in the top section of the Data Properties and Settings panel. You can control the visibility of a multi-ROI within a scene with the icons available in the top section of the panel and view its properties in the lower section. A pop-up menu is available that provides access to tools for exporting, importing, and further processing multi-ROIs (see Multi-ROI Pop-Up Menu).
Multi-ROI properties and settings
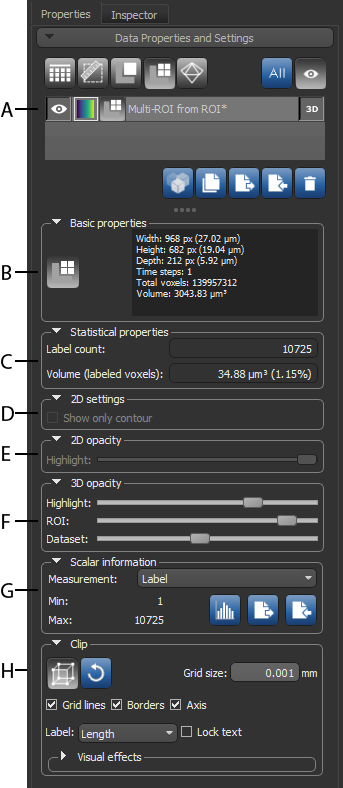
A. List of multi-ROIs B. Basic properties C. Statistical properties D. 2D settings E. 2D opacity F. 3D opacity G. Scalar information H. Clip
All multi-ROIs that are available are listed in the top section of the Data Properties and Settings panel.
- Click the Multi-ROI
 icon at the top of the data Properties and Settings panel to see the available multi-ROIs. See Filters for information about filtering the listed items.
 - Click the Eye icon on the left side of the listed item to show or hide the multi-ROI in the currently selected scene. Click the 3D icon to show or hide the multi-ROI in a 3D view. See Object List for more information about changing the visibility of a multi-ROI, as well as renaming and copying multi-ROIs.
- Select a multi-ROI to view basic information about the multi-ROI and its statistical properties (see Basic Properties, Statistical Properties), as well as to access settings to modify its appearance (see 2D Opacity, 3D Opacity, 2D Settings, and Clip).
- Right-click the required multi-ROI to access functions for analyzing objects and other functions (see Multi-ROI Pop-Up Menu).
The information available for a selected multi-ROI includes its geometry, size, and volume.
| Description | |
|---|---|
|
Width |
Indicates the total number of pixels along the X-axis and its physical dimension*. |
|
Height |
Indicates the total number of pixels along the Y-axis and its physical dimension*. |
|
Depth |
Indicates the total number of pixels along the Z-axis and its physical dimension*. |
|
Time steps |
Indicates the size of the time (T) dimension. |
|
Total voxels |
Indicates the total number of voxels within the shape of the multi-ROI. Calculated as width*height*depth*time steps. |
|
Volume |
Indicates the total volume occupied by the shape of the multi-ROI. Calculated as total voxels*voxel size cubed. |
* Calculated as pixels*spacing.
The following statistical properties are available for a selected multi-ROI. Additional statistical properties, if calculated, can be viewed in the Measurement Inspector (see Using the Measurement Inspector).
| Description | |
|---|---|
|
Label count |
Indicates the total number of labeled components in the multi-ROI. Whether or not components are connected is defined by connectivity. |
|
Volume (labeled voxels) |
Indicates the volume of all labeled voxels within the selected multi-ROI. Percentage (%)… Is the comparative percentage of the volume of labeled voxels and the total number of voxels within the shape of the multi-ROI. |
The options in the 2D settings box, shown below, let you change the appearance of multi-ROIs in the 2D views of the current scene.
2D settings
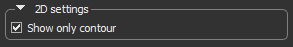
If the Show only contour item is checked, the highlight applied to the selected multi-ROI will only appear along the contour of the object.
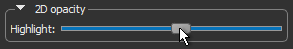
Use the Highlight slider, shown below, to adjust the opacity of the colored highlight applied to labeled voxels in 2D views.
2D opacity
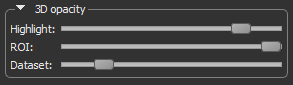
The sliders in the 3D Opacity box control how multi-ROIs appear in 3D views. You can change the applied highlight, extract multi-ROIs so that only they are visible, or you can subtract multi-ROIs so that everything except the labeled voxels is visible.
You must make sure that the selected multi-ROI is visible in both the scene (Eye icon) and in the 3D view (3D icon) to control its opacity here. The appearance of a multi-ROI can also be adjusted in the Opacity Settings dialog (see Opacity Settings).
3D opacity
| Description | |
|---|---|
|
Highlight |
Adjusts the opacity of the colored highlight applied to the selected multi-ROI. At a value of 100%, the highlight will be fully opaque. At a value of 0%, the highlight will be transparent. |
| ROI | Adjusts the opacity of the labeled voxels in the multi-ROI, using the values of the associated dataset. |
| Dataset | Adjusts the opacity of the dataset values that are outside the selected multi-ROI. |
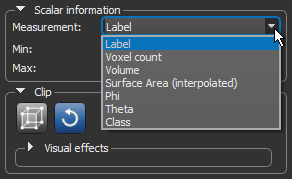
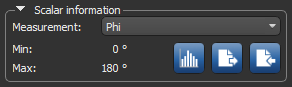
Measurements that were previously computed for the selected multi-ROI, imported from a file, or copied from another object, are available in the Scalar information box, as shown below.
Scalar information box
|
|
Description | |
|---|---|---|
|
Measurement |
|
Indicates the current measurement that is selected and mapped in the views of the multi-ROI. Scalar information for a multi-ROI can be computed in the Object Analysis dialog (see Analyzing Multi-ROIs). Measurements computed for the multi-ROI are available in the drop-down menu, as shown below.
Min… Indicates the minimum value of the currently selected measurement. Max… Indicates the maximum value of the currently selected measurement. You should note that the Label measurement refers to the identifier assigned to each labeled component in the multi-ROI and that the maximum value may not be equal to the label count. For example, if you have merged, split, or deleted objects. The label count is always the total number of labeled components in the multi-ROI. |
| Histogram |
|
Lets you plot the distribution of a selected measurement and extract basic statistics, such as the minimum, maximum, mean, and standard deviation value of the selected measurement. |
| Export |
|
Lets you export selected scalar values to a comma-separated values file (*.csv extension). |
|
Import |
|
Lets you import scalar values from a comma-separated values file (*.csv extension). |